

PE-backed specialty health & wellness

Sector: specialty health & wellness. Sponsor: middle-market PE (recent acquisition). Thesis: aggressive unit expansion. Engagement: audit + implementation.
+20% revenue uplift identified across 4 digital channels
Quantified across Paid Search, SEO, Paid Social, and Conversion Rate Optimization in a Claymore Digital Growth Audit delivered at acquisition. Implementation in progress. Stronger per-location revenue economics directly supported a faster de novo rollout cadence.
The situation
A PE-backed specialty health & wellness operator, freshly acquired on an aggressive unit-growth thesis, entered Claymore's engagement with a tech and data foundation that could not scale with the plan. Fragmented systems across scheduling, CRM, and marketing. No single source of truth. No attribution across digital channels. Claymore was engaged to audit the foundation and install what the investment thesis required: a data layer capable of supporting multi-unit scaling.
Diagnosis
01. Fragmented systems, no single source of truth
Scheduling, CRM, e-commerce, marketing, and reviews each running on separate platforms with limited integration. No unified view of customers, locations, or operating performance across the multi-unit footprint. A foundation built to scale would not emerge from this stack.
02. No attribution across digital channels
Zero tracking of spend-to-appointment across Paid Search, SEO, Paid Social, or site conversion. Marketing spend was unaccountable at channel and location level. Performance could not be managed because it could not be measured.
03. Passive referrals driving the largest acquisition channel
38% of new revenue came from word-of-mouth referrals, with no formal referral program, no tracking, no incentive structure. The single largest source of customer acquisition had no operating levers on it.
The intervention
01. Systems
Migrated the website and forms off WordPress onto HubSpot CMS. Consolidated the tech stack into a HubSpot-centric ecosystem integrated with Boulevard (scheduling), Shopify (e-commerce), and Birdeye (reputation). One stack, one operating model, engineered to scale with the footprint.
02. Data & BI
Rebuilt the data layer from a near-blank slate. Single source of truth across marketing, operations, and clinical activity. Full attribution coverage. BI dashboards so the business runs on daily decisions, not monthly hindsight. Unified referral tracking, customer analytics, segmentation, and scoring at the foundation layer.
03. Customer journey
Mapped the patient journey end to end across specialty services. Standardized lifecycle management from lead to appointment to ongoing care, with targeted interventions at each drop-off point. Consolidated inbound calls into a central call center.
04. Digital channels
Four-channel revenue opportunity quantified and in active implementation: Paid Search (campaign consolidation, keyword expansion, Performance Max), SEO (existing + new content, local SEO, backlinks), Paid Social (conversion optimization, lookalikes, retargeting), and CRO (homepage, landing pages, signup flow).
05. Growth operating model
Installed the operating model that multi-unit scaling requires: unified reporting across all locations, standardized KPIs, real-time BI for operational decisioning, and a data foundation engineered to hold up as the de novo rollout continues.
The results
- +20% revenue uplift identified across digital channels.
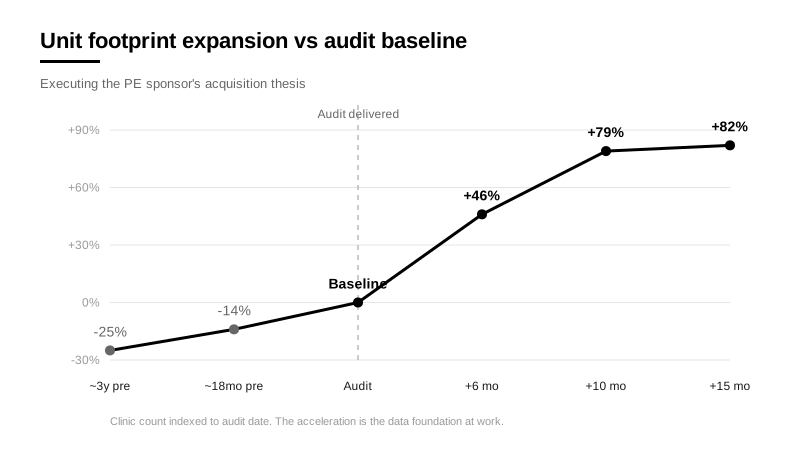
- +82% unit expansion enabled, 15 months post-audit.
- 4 digital channels quantified and in implementation.
- 1 source of truth across the platform.
Diagnosed and delivered using the Claymore Digital Growth Audit
- Paid Search. Campaign consolidation, keyword expansion, ad-copy and policy, Performance Max.
- SEO. Existing content, net-new content, local SEO, backlinks, technical health.
- Paid Social. Conversion optimization, lookalike audiences, retargeting, market and product expansion.
- CRO. Homepage, paid landing pages, signup flow, message match across the path to conversion.
Confidential. Client identity anonymized at sponsor request.
