

The Brand Tax

01 · The board meeting
The first board meeting after close is when the new owners decide to set the business on fire and call it discipline.
I have sat in a lot of these. The deck is the standard 100-day plan. Slide six is the marketing review. Some guy on the deal team who joined the firm eight months ago has been through the prior owner's P&L and circled the line items that look like discretionary spend. Brand sits at the top of that list, normally bundled with sponsorships, agency retainers, and whatever the prior CMO was running on television.
The number is meaningful. In a home services business doing $200m of revenue, it is not unusual to find seven to nine million dollars in that line, almost none of it tied to a measurable lead.
There is usually one item that turns out to be the founder's daughter's lacrosse club. That is a different paper.
The conversation takes about fifteen minutes. The CFO points out that the brand spend is roughly equal to the EBITDA delta the deal team underwrote in year one. The operating partner asks if anyone has ever seen a paid-attribution report on it. Nobody has. The CMO, if there is still a CMO at this point, makes a case about awareness and consideration that lands the way it always lands in a room of people who underwrite cash flows, which is to say, it does not.1
The decision gets made. Brand spend is cut sixty percent in Q1, eliminated in Q2, and the savings flow into the year-one EBITDA bridge.
Everyone leaves the meeting feeling good. The deal team has demonstrated cost discipline. The operating partner has a quick win for the next IC. The CFO has protected the model. On any reasonable read of what just happened, the right call was made. You cannot defend a line item that nobody can measure, and PE buyers do not pay multiples for unmeasurable spend.
Two and a half years later, in the same business, somebody is sitting in a different conference room trying to work out why CAC is up forty-three percent and why the lead volume from organic and direct has fallen off a cliff that the dashboard does not explain.
The agency has theories. The CMO, who is the third one in the chair since close, has theories. The performance team is doing everything right and the numbers are getting worse anyway. Nobody mentions the meeting from year one because nobody in the room was at it.
That is the brand tax. Not the cost of building a brand. The cost of cutting one.
02 · The cut that looks rational
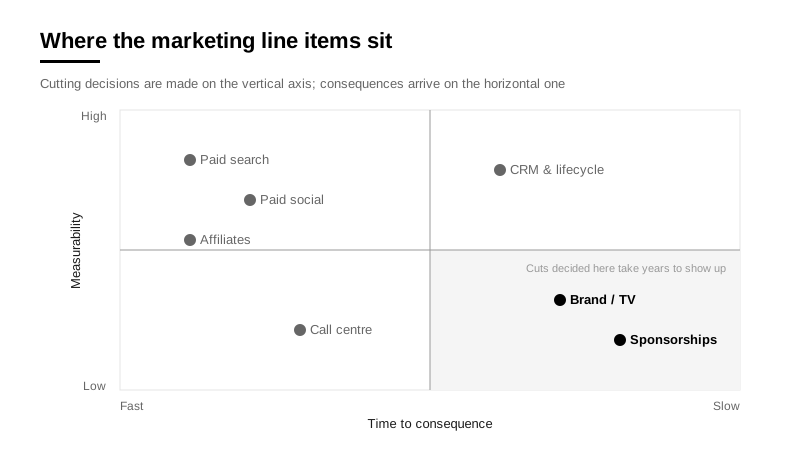
Private equity has a sophisticated view of every line on the marketing P&L except the one that determines what all the others cost.
Let me be clear about what this is not. This is not the argument where I tell you that PE buyers are philistines who do not understand brand, and the answer is to stop cutting marketing. That is a lazy argument and I am not making it.
Most of the brand spend I see in portfolio companies at entry is genuinely wasteful. Vanity TV nobody on the executive team can connect to a commercial outcome. The lacrosse club. Sponsorships that exist because the founder went to that university. Agency retainers that have not been renegotiated since 2019.
If you walk into a business and find that, you should cut it. The discipline is correct.
The problem is not the cut. The problem is the assumption underneath the cut. The assumption is that anything that cannot be tied to a measurable lead in the current quarter is not contributing to the lead volume the business currently has.
That assumption is wrong. It is wrong in a specific way that makes the consequences invisible for eighteen to twenty-four months, which is conveniently longer than most operating partners stay in the seat.
Most of what a brand does in a category with a long consideration window is not generate leads. It changes the conversion economics of the leads other channels are generating. The customer who has heard of you, even faintly, even in a way they could not articulate to a researcher, converts at a different rate than the customer who has not. Paid search keywords cost what they cost partly because of where you sit in the customer's prior awareness set. Direct traffic exists because somebody, at some point, gave you a portion of their attention for free.2
None of this shows up in a last-click attribution model, which is the model that runs every IC discussion of marketing in private equity.
When you cut the brand spend, you do not lose those leads on Monday morning. You lose them slowly. For the first six months it looks like normal channel variance. For the next six it looks like a soft macro. For the six after that it looks like an attribution problem the new CRM is going to solve.
By the time the pattern is unmistakable, the people who made the original decision have moved on, the agency has been replaced, and the operating partner now in the seat is dealing with what looks like a structural CAC problem in a category that has, in fact, structurally not changed at all.
03 · What antibiotics do to a gut
If you would not take a course of antibiotics every quarter to prove you do not have an infection, you should not be cutting brand every quarter to prove you do not need it.
It is worth stepping outside the marketing P&L for a moment, because what I am describing is not specific to marketing. It is what happens any time a system has a load-bearing component that nobody has the instruments to measure.
Take a course of antibiotics. You have an infection. The infection is measurable. It has a name, a culture, a sensitivity panel. The antibiotic clears it.
The right call was made. You cannot let an infection run, and the alternative was worse.
What also gets cleared is the population of bacteria you cannot see and did not know was doing work. The trillions of organisms managing inflammation, regulating immunity, processing nutrients, suppressing pathogens, and doing a hundred other things that nobody bills for and nobody measures in routine clinical practice.
Three years later the same patient is in a different consulting room with a constellation of conditions that nobody traces back to the course of antibiotics in 2019, because the data infrastructure required to make that link does not exist outside research labs.

This is the same shape as the brand cut. A visible, measurable problem. A visible, rational intervention. A visible, immediate result. Invisible damage to an underlying ecology that the rest of the system depended on without knowing it. A long, slow drift that does not get attributed to its cause because the data infrastructure required to make the attribution does not exist.
The point is not that brand is sacred or that you should never cut it. The point is that you should know what you are cutting.
Brand is closer to a microbiome than it is to a campaign. It is an ecology, not a project. You can damage it quickly and rebuild it slowly. The rebuild does not always reach the original state.
04 · The measurement problem is the real problem
If the answer were "stop cutting brand," it would not survive a single IC meeting, and it should not.
Private equity has built remarkably good measurement infrastructure for everything except brand. We can underwrite the unit economics of a paid search campaign down to the ad group. We can model retention curves with reasonable precision. We can get a portfolio company's CRM to produce an attribution report that ties closed-won revenue to the channel that originated it.
Brand sits outside this. Its effect is lagged, probabilistic, and interacts with every other channel in ways that are not separable in a regression. The honest econometric answer is that you can get directionally useful estimates with marketing mix modelling, geographic holdouts, and incrementality testing. None of them are clean enough to satisfy a deal team that wants to know what the IRR is on the next dollar of brand spend by Friday.3
The closest analogue is pension accounting. Defined benefit pensions hold a similar kind of obligation: long-dated, probabilistic, only partially visible in any given year's accounts. For decades, the accounting infrastructure required to make pension underfunding visible was not in place. Plans drifted into structural underfunding without anyone in the system being responsible for it.
The accounting standards that finally forced this into the open, GASB 67 and 68, were issued in 2012, and they took thirty years to develop. The equivalent infrastructure for brand does not yet exist anywhere in the PE industry. We are operating in the equivalent of pre-1980s pension accounting.
The obligation is real. The underfunding is real. The accounting does not see it.
So the buyer applies the same hurdle rate to brand that gets applied to every other capital deployment, which means cutting it because it cannot meet a hurdle rate it was never designed to meet. The result is a structural bias toward cutting. Not because anyone is wrong about the rationality of the individual decision. Because the measurement infrastructure for the alternative does not exist at the level of rigour the asset class demands.
05 · Anvil Home Services
Anvil's marketing team is doing everything right and the numbers are getting worse anyway. There is a reason.
Here is a composite portfolio company. The numbers are illustrative. The pattern I have now seen in some version across more than a dozen home-services and consumer-services businesses. Call it Anvil Home Services.4
Anvil is a regional home services business operating in nine US markets at entry. Revenue at close is $215m, EBITDA is $32m, the deal closes at 9.5x. The marketing P&L at close is $26m, of which roughly $9m is what the prior owner has been calling brand. The remaining $17m is performance: paid search, paid social, an affiliate programme, a small CTV test, and call centre infrastructure.
In the first 100 days the new operating team commissions a marketing audit. The audit, of course, cannot tie any portion of the $9m brand spend to a measurable lead within a 30-day attribution window.
Nobody runs an audit expecting to find that brand is working.
The recommendation is to cut brand spend by 70 percent in year one, redirect a portion to performance, and use the remainder to fund a CRM and attribution infrastructure project. The maths is good. The IC is happy. The cut goes through in Q2.
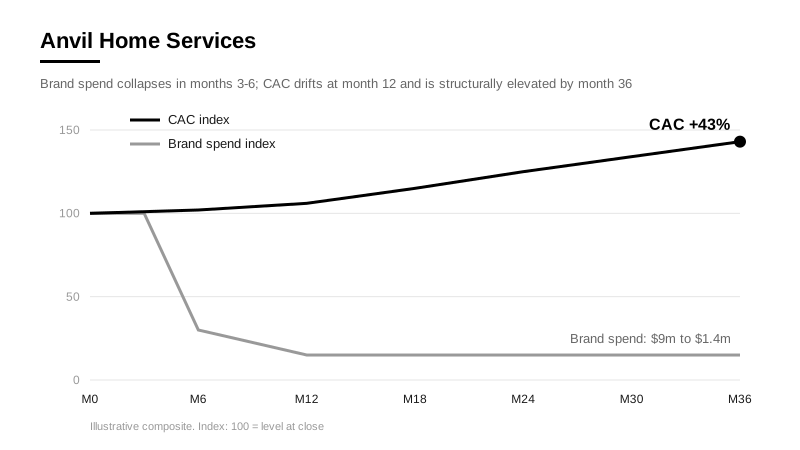
Year one ends roughly on plan. EBITDA is $38m, slightly ahead of model. The brand cut has flowed cleanly to the bottom line. Lead volume is down 4 percent, which the team attributes to a soft consumer environment in two of the nine markets. CAC is up 6 percent, within the range of expected variance. Nobody is alarmed. The first investor letter on Anvil is positive.
Year two is when the pattern starts. Lead volume from paid search holds, but the cost per lead climbs 18 percent. Direct traffic, historically about 23 percent of total digital lead volume, drops to 17 percent and keeps drifting. Organic search lead volume falls 11 percent. The team attributes this to algorithm changes at Google, which is partially true. The agency runs a series of paid social tests that produce reasonable short-term lift but do not solve the underlying drift.
What the agency is doing is buying time.
The CMO is replaced in Q3, which is the standard response when CAC drifts and nobody knows why. EBITDA comes in at $41m against a plan of $46m.
Year three is the expensive year. CAC is now 43 percent above entry. Lead volume from previously free or low-cost channels has structurally declined and the team is replacing it with paid acquisition that costs three to four times more per converted customer. The performance team is doing everything right.
The unit economics are deteriorating anyway.
EBITDA comes in at $44m. The exit committee is told the business is worth roughly the same multiple it was bought at, which means three years of operating effort have produced about $12m of incremental EBITDA against a model that called for closer to $25m.
Somebody at the partnership level is going to have an uncomfortable conversation with their LPs about why.
When the eventual buyer does diligence, they will find a business with a structurally elevated CAC, a thin awareness footprint relative to the leading regional competitor in each of the nine markets, and a digital marketing programme that is, in pure performance terms, well run. They will also find that the brand line, which was $9m at the prior entry, is now $1.4m. They will note this.
They will not connect it to the CAC drift, because nothing in the data they are looking at will let them connect it. They will price the business on the trailing performance and the deal will close at a multiple that bakes in the elevated CAC as the new normal.
The next buyer pays a lower multiple for a higher cost base. The discount is the brand tax made visible at exit.
None of this is a failure of execution. The operating team did everything the playbook called for. The cut was rational at the moment it was made. The redirected spend went to better-measured channels. The performance team did good work.
The business still ended up structurally more expensive to grow at exit than it was at entry, and the gap between the year-one model and the year-three reality is the brand tax.
06 · The cod
The Canadian government had thirty years of data on cod stocks and a moratorium that has now lasted thirty-three years. Make of that what you will.
There is one more thing to say about brand, which is the part I am least sure about and which I therefore want to handle directly rather than paper over.
Some portion of brand value is irrecoverable once cut.
If you are out of the market in a category for two years, the equity you had at entry does not come back when you start spending again. You are starting from a lower base. I do not know how to underwrite that in a model. I have not seen anyone else underwrite it well either.
The cleanest example I know of what this looks like at scale is the collapse of the Grand Banks cod fishery. For four hundred years, the cod fishery off Newfoundland was the most productive in the world. The data on cod stocks was visible the whole time. The Department of Fisheries and Oceans Canada had been measuring it for decades.
The cuts to the stock happened decision by decision, quota by quota, each one rational at the moment it was made. Catches peaked at over 800,000 tonnes in 1968. The spawning biomass dropped 82 percent between 1962 and 1977, and a further 11 percent over the following fifteen years.
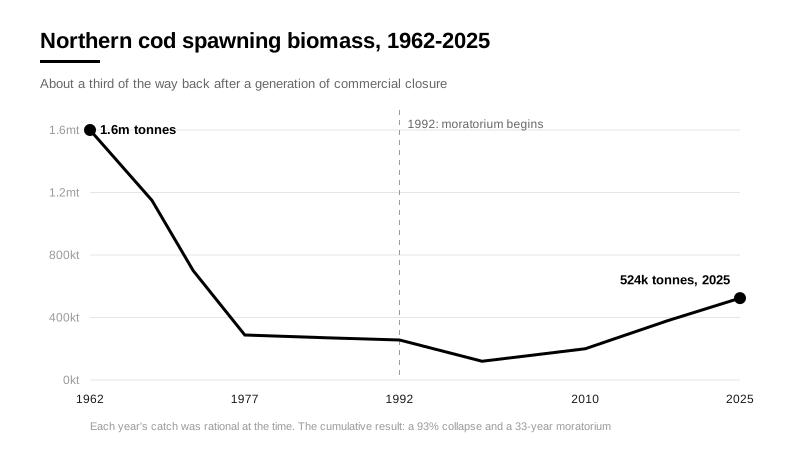
In 1992 the Canadian government imposed a moratorium. Thirty-three years later, the stocks have partially recovered to roughly 524,000 tonnes in 2025, against a 1962 baseline of 1.6 million tonnes. About a third of the way back, after a generation of complete commercial closure.5
The fishery that supported coastal Newfoundland for half a millennium has not returned, and the towns that depended on it largely have not either.
This is not an argument that brand cuts are as bad as fishery collapses. Nobody is going to lose their grandfather's livelihood because Anvil Home Services cut its TV budget. It is an argument about the shape of the system. Visible data nobody acted on. Decision-by-decision rationality producing an outcome nobody chose. A recovery period longer than the careers of the people making the cuts. An asset that does not come back the way it left.
When you cut something whose recovery dynamics you do not understand, on a timeline shorter than the recovery period of that thing, you are making a one-way trade and pricing it as if it were two-way.
The Canadian government did not intend to permanently destroy the cod fishery. It intended to extract value at a sustainable rate and got the rate wrong. The PE industry is doing something analogous to brand. The intent is not to permanently degrade the awareness footprint of every portfolio company that gets traded between funds. The intent is to extract value at a rational rate while the asset is in hand.
The rate is wrong because the system underwriting it has not yet developed the instruments to know what the right rate is.
07 · Four things that might matter
There is no tidy answer to this. If there were, the industry would have adopted it.
There are some things I have come to believe matter more than I used to think they did.
The first is that the cut, when it happens, should be sequenced differently. There is a version of the brand cut that takes a year, ladders the reduction across markets, and uses geographic holdouts to actually measure what is happening. It is more expensive in the short term and produces better information. Most PE firms do not do this because the savings are slower to flow through, and the operating partner who needs the year-one win does not have the patience for it.
That is a structural problem with how the industry runs the first 100 days, not a problem with the analysis.
The second is that the question of who owns brand inside a portfolio company is almost always answered wrong. Brand sits with the CMO, who reports to the CEO, who reports to the board. In the businesses I have seen, CMO tenure runs about half the typical hold period, CEO tenure runs about three-quarters of it, and the board changes when the business changes hands.
Nobody in that chain has a structural incentive to defend a line item whose payoff sits beyond their own time horizon.
By the time the year-three CAC problem shows up, the year-one CMO has been gone for eighteen months and is happily running marketing at a different portfolio company that is about to make the same cut.
This is funny in a dark way. It is also an incentive design problem. It gets solved at the LP level or it does not get solved at all.
The third is that the marketing audit at entry asks the wrong question. The standard audit asks whether the marketing spend is efficient. That is the wrong question, because efficiency is measured against a hurdle rate that brand cannot meet. The better question is whether the marketing portfolio is correctly allocated across asset classes with different duration, different measurability, and different return characteristics. That is a different audit. It produces different recommendations. It does not lead to the same year-one cut.
The fourth is the unresolved part. Some portion of brand value is irrecoverable once cut, and the cod fishery is the cleanest example of what that looks like at scale. We do not yet have the framework to underwrite this properly.
Saying so out loud is more useful than pretending we do.
Conclusion: the line on the spreadsheet
Brand is the only line on the P&L that the spreadsheet thinks is optional and the customer thinks is the entire reason they called you.
The reason it gets cut first is that it is the line item that looks the most like a choice. Performance marketing looks like infrastructure. Salaries look like obligations. Rent looks like physics.
Brand looks like a decision somebody made, and decisions can be unmade by a different person in a different room.
That is the trick of it. The brand line is not a decision. It is a position in the customer's mind that took years to build and costs a fraction of what it is worth to maintain.
When you cut it, you are not unmaking a decision. You are exiting a position.
You are selling an asset for whatever the spreadsheet says it is worth, which is zero, because the spreadsheet does not have a column for it.
The buyer who understands this is rare. The buyer who underwrites it is rarer.
Most of the industry will continue to make the rational year-one cut and pay the year-three tax, and the businesses that get traded between funds will keep getting structurally more expensive to grow with each turn of the ownership clock.
The most useful thing anyone reading this can do this quarter is read the marketing P&L the way a credit investor reads a balance sheet.
Not what is each line item costing me. What position is each line item holding, and what happens to the rest of the book if I close it.
The line on the spreadsheet is not the cost. The line on the spreadsheet is what you stop owning when you cut it.
Notes
- There is a better version of this meeting that takes a year, runs geographic holdouts, and produces information instead of just savings. I have seen it. Once.
- There is a counter-argument that some awareness erodes naturally over time and would have eroded anyway. I do not buy it in categories with steady-state competitive dynamics. I want to flag it because it is the strongest version of the case for cutting and people who want to keep cutting will use it. We do not have clean enough natural experiments to settle it either way.
- The aggregate funded ratio for US state and local pension plans has been below 90 percent for eighteen consecutive years (Equable Institute, 2025). Below 90 percent is the threshold actuaries consider the floor for resilience. Most plans have not been resilient for two decades, and the accounting only made this visible after the fact. The equivalent reform for brand has not happened anywhere.
- Numbers are illustrative. Anvil is constructed from patterns seen across more than a dozen home-services portfolio companies, none of them named. The actual cases tend to look worse than this, not better.
- I am not fully sure about this. There is a version where brand value erodes faster than the cost shows up, in which case the trade is worse than described. There is also a version where the awareness footprint is durable across a year or two of underinvestment, in which case it is much better. I lean toward the first. I would not bet the paper on it.
perspectives

The Business Underneath

How to Build a Modern PE Firm