

Marketing as an Asset Class

Marketing as an Asset Class is an operating framework that treats a portfolio company’s marketing engine — its data foundation, technology stack, and customer-acquisition system — as a balance-sheet asset that can be audited, valued, improved and priced at exit, rather than as a discretionary expense line.
Marketing as an Asset Class is not the same as a “marketing asset.” A marketing asset is a piece of collateral — a brochure, a landing page, a logo. Marketing as an Asset Class is an operating framework for valuing and improving the whole acquisition engine as a balance-sheet item.
01 · What the Balance Sheet Used to Refuse
Goodwill did not exist as a balance sheet item until 1944.
Before that, the asset side of a corporate balance sheet held only what was tangible and titled. Plant. Inventory. Receivables. Cash. Anything else, anything that produced economic value but could not be touched or sold separately, was excluded on the grounds that the accountant could not measure it without judgment, and accounting was supposed to be a record of fact rather than a judgment about future value. Companies acquired other companies for prices that obviously included more than the sum of the tangible parts, and the difference simply disappeared into the consolidating entity. The balance sheet refused to show it, because the balance sheet refused to recognise anything that could not be appraised by someone other than the buyer.
Goodwill arrived because that refusal stopped being tenable. Acquisition activity in the postwar period produced enough corporate combinations that the difference between the price paid and the tangible assets received could no longer be ignored. The numbers were too large. The standard-setters relented. They did not relent because they had cracked the measurement problem. They relented because pretending the value was not there was distorting every other number on the page.
The same thing happened, more slowly, with internally generated software. Until the late 1990s, software developed for internal use was expensed as it was created, even when it was building durable systems that would run the business for a decade. The accounting argument was the same as the goodwill argument had been: there was no transaction price, no separable asset, no way to test it for impairment without the company's own claims about its useful life. The pragmatic argument also turned out to be the same. By the late 1990s, software was a meaningful share of the durable productive infrastructure of every large company, and treating it entirely as period expense produced income statements that no longer reflected what the company was actually doing. SFAS 86 admitted some categories. SOP 98-1 admitted more. The standard caught up to the economy.
The same thing happened with customer relationships and acquired intangibles, when SFAS 141 in 2001 forced acquirers to break the goodwill bucket into named line items: customer lists, trade names, non-compete agreements, in-process research and development. Each had been bundled inside goodwill for half a century. Each was difficult to measure. Each was admitted because the alternative produced consolidated balance sheets that obscured what had actually been bought.
The pattern is consistent. The accounting profession excludes a category of value for as long as the measurement problem is harder than the distortion of pretending the value is zero. When the distortion gets large enough, the standard moves. The methodology arrives later, sometimes much later, and is always imperfect when it arrives. The methodology does not need to be clean. It needs to be less wrong than zero.
The accounting profession is the second-slowest mover here. The slowest is private equity. Public-market investors have been pricing brand into multiples for thirty years. Strategic acquirers have been doing it since the 1990s. Sovereign wealth funds and family offices have been doing it loudly enough to publish methodology papers about it. Private equity, the asset class that has the most granular access to portfolio-company data of anyone in the building, is the asset class still presenting brand as a single line on a marketing P&L and asking the operating team to defend it.
Brand sits at exactly that pre-admission moment now.
Internally generated brand value is excluded from the balance sheet on the same grounds that goodwill, capitalised software, and acquired customer lists were once excluded. The methodology is messy. The lifespan is uncertain. The control test is hard to pass because the customer's loyalty cannot be repossessed. None of these objections are wrong on their own terms. They are also the same objections that were raised against every other intangible asset before it was admitted, and that lost when the value being pretended away got too large to ignore.
The argument of this paper is that for private equity specifically, that moment has now arrived. The brand asset that sponsors decline to put on the balance sheet during the hold is the same asset that determines the exit multiple. Pretending it has no value is no longer an internally consistent position. It is a measurement system lagging the economy it claims to describe.1
This paper is not an argument with the accountants. The accountants will get there. This is an argument that private equity does not need to wait for them.
02 · The Modelling Question
Sponsors do not need GAAP to recognise an asset before they recognise an asset.
The job of a sponsor is not to mirror the balance sheet. The job is to value the business correctly enough to underwrite a return. Sponsors already do this routinely with categories of value that GAAP does not put on the balance sheet at all. Customer lifetime value is modelled in every consumer deal. Synergy value is modelled in every roll-up. Talent retention is modelled in every services deal. The deal model would be wrong without these. The deal model treats them as economically real even when the financial statements do not. The deal team makes that judgment because the alternative, pricing the business as if these categories of value did not exist, would produce returns the firm could not defend to its LPs.
The same logic applies to brand. There is no methodological obstacle to modelling it. The Marketing Accountability Standards Board has spent twenty years building approaches. Interbrand and BrandFinance produce corporate-level valuations using methodologies that public-market investors have used for decades. Customer-based corporate valuation, the framework developed by Daniel McCarthy and Peter Fader at Wharton, derives enterprise value from the customer base directly using only unit-economics data the company already has. None of this is fringe. None of it is new. All of it is in active use by sophisticated investors who happen to operate in markets that publish balance sheets. Almost none of it is in active use by private equity at the deal level, despite private equity having more granular access to the underlying data than any public investor ever does.
The fact that an asset is intangible, unenforceable and difficult to measure does not mean it is absent from the company's value. It means the company's value is partially obscured by a measurement system designed for a different industrial era.
The issue is not methodology. The methodology exists. The issue is institutional. Treating brand as an asset class requires the deal team and the operating team to share a vocabulary, and the deal team owns the model. The model is built in the language of cost, EBITDA and multiple. The asset case for brand is built in the language of customer cohort, awareness curve and category position. The two languages do not translate cleanly, and so one wins. The one that wins is the one closer to the spreadsheet.
What would it look like to fix this. At minimum, three things. Marketing investment classified by horizon, not function. A depreciation schedule applied to brand equity, even if only for internal use. A cost of capital applied to marketing decisions the same way it is applied to capex. None of this requires a change to GAAP. All of it requires the deal team to build a different model.2
The question is whether they will.
03 · The Three Horizons
Marketing spend is not one thing. It is at least three.
There is the spend that produces revenue this quarter. Paid search, retargeting, performance display, the bottom-of-funnel mechanics that take a customer who already wants to buy and route them to a transaction. This spend has a near-instantaneous feedback loop. A dollar in produces a measurable dollar out, usually within thirty days, sometimes within thirty minutes. Most CFOs are comfortable with this category because it behaves like every other variable cost. It scales with output. It can be paused without consequence. It is, in every meaningful sense, an expense.
There is the spend that produces revenue next year. Demand generation, partnerships, content strategy, the upper-funnel work that creates the pipeline performance marketing later closes. This spend has a one-to-three year payback profile. The feedback loop is delayed enough that a single quarter's data is not interpretable. Cutting this spend in Q1 produces a slow degradation in pipeline that does not become visible until Q3 or Q4, by which point the cut has been internalised as the new baseline. This is the category sponsors most often misclassify. It looks like the first category from a distance and behaves like the third up close.
And there is the spend that produces enterprise value. Brand investment, category creation, share-of-voice maintenance, the work that compounds over five-year horizons and shows up in exit multiples rather than next month's revenue line. This spend has a feedback loop that is longer than most hold periods. The portfolio company that under-invests here for four years will exit at a lower multiple than its peers and the operating partner will have moved to another firm before the consequence is visible.
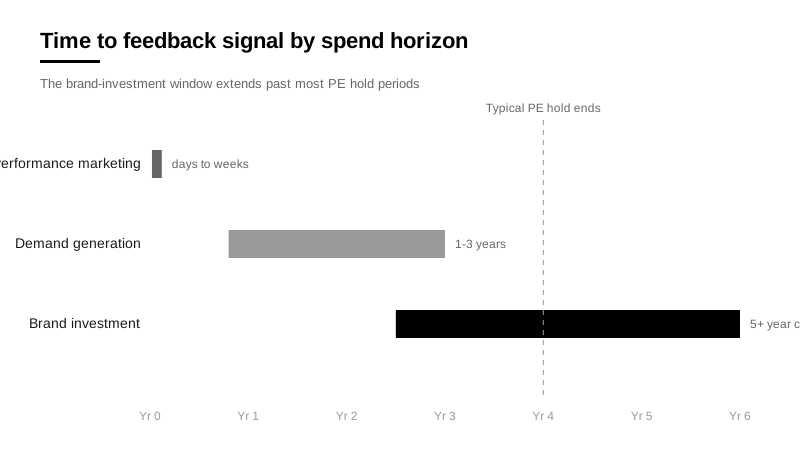
These three horizons require three different management approaches. They are almost always managed as one.
The collapse happens because EBITDA is reported monthly. Every dollar of marketing spend, regardless of horizon, hits the same line in the same management report. A dollar of brand investment that will produce a fifteen percent multiple uplift in three years is indistinguishable, in this month's variance analysis, from a dollar of paid search that produces a two-times return next week. The two are subtracted from this quarter's EBITDA at the same rate. Their effect on enterprise value is wildly different. The variance report cannot tell.
This is the structural failure. It is not that anyone has decided brand investment does not matter. It is that the reporting system has decided it does not matter, by treating it the same way it treats the disposable, and the reporting system gets the last word.
The fix is unglamorous. Marketing budget classified into the three horizons, each with its own performance metric, each reviewed on its own cadence. Performance marketing on the monthly cycle it deserves. Demand generation on a six-month rolling pipeline metric. Brand investment on a quarterly share-of-voice and prompted-awareness measurement, judged against category benchmarks rather than internal forecast. None of this is hard. All of it requires the operating partner to insist that the CFO produce two more views of the marketing line than the system currently produces. For the working version of that classification, budget line by line, see our guide to setting a marketing budget in a PE-backed company.
This is rarely insisted upon. The CFO is busy. The operating partner does not want to be the one demanding more reporting from a function the deal team is already pressuring. The CMO does not have the standing to ask. So the marketing line gets cut as a single number in a single meeting, and the three horizons of value collapse into one column of expense, and the consequence shows up two years later in the exit memo, where it is described as "softer than expected category performance" and attributed to market conditions.3
04 · The Asset and the Income
BP's reserve replacement ratio for 2025 was 90 percent.
That is the technical way of saying the company replaced ninety cents of every dollar of oil it produced. The arithmetic is straightforward. The company is, slowly and deliberately, getting smaller. Shell's CEO has publicly acknowledged the same thing, and Wood Mackenzie has put the production gap at 800,000 barrels of oil equivalent per day over the next decade. Neither company is in trouble. Both companies are managed by competent people. Neither current management team made the decision that produced the arithmetic.
The decision was made in the 2010s. Exploration capex was cut, partly for ESG reasons and partly because exploration is high-risk spending with a ten-to-fifteen-year payback profile and the executives carrying the budget had three-to-five-year tenures. The cuts were defensible at the time. Production looked fine for years afterwards. The reserve register was the only register that was telling a different story, and the reserve register is the asset that determines what the company is worth in 2030. By the time the reserve replacement ratio fell below one, the executives who made the original decision had already been promoted to roles where reserve depletion was somebody else's problem. The current CEOs are managing a smallerness they did not cause, with a tool kit (acquisition or expensive new exploration) that is more costly than the prevention would have been.
This is the structural problem private equity has with brand. The reserve register is the brand. The exploration capex is the brand investment. The three-to-five-year executive tenure is the four-year hold period. The 2030 production gap is the exit multiple. The decision-makers are out before the consequence arrives, and the consequence arrives in a form that the next set of decision-makers cannot easily reverse.
Private equity has the income statement and nothing equivalent to the reserve register. The portfolio company that hits its EBITDA number this quarter by deferring brand investment is not the same as the portfolio company that hits its EBITDA number this quarter through genuine operating leverage. They look identical in the variance report. They are not identical. One is producing from a maintained reserve. The other is producing from a reserve that is not being replaced. The reporting system does not record the difference because the reserve is not on the books, which means no one is responsible for its condition, which means it depletes on a timeline longer than the partner who is supposed to be accountable for it.
Consider what this looks like when a sponsor makes the opposite call.
A mid-market sponsor acquires a consumer-adjacent business at a similar profile to the one above. The investment thesis explicitly classifies the brand as an asset to be invested into, not a cost line to be optimised. This is a deliberate choice and it is taken in the underwriting model, not in a memo afterwards. The deal team builds a five-year forecast in which marketing spend rises modestly each year, brand-health metrics are tracked quarterly against category benchmarks, and the exit multiple is underwritten at a half-turn premium to the entry. The IRR sensitivity at the bottom of the model still works, because the reduction in CAC over time pays for the increase in upper-funnel spend. The model is harder to build and easier to defend.
Year one installs the measurement infrastructure. Prompted brand awareness, share of search, prompted-versus-organic split, repeat purchase by cohort, price elasticity against unaided demand. None of this is exotic. All of it requires the operating partner to insist that the CFO produce two more views of the marketing line than the system natively produces. The CFO does not want to do the work and tells anyone who will listen that this is what consultants are for. The CMO, who has spent a career being measured on impressions and CPMs, runs hot for the first quarter because the new metrics expose how little the old metrics were measuring. By the second quarter the CMO has settled and discovered that being measured against unit economics is, on balance, easier to defend than being measured against attribution models nobody believes. The first quarterly board pack contains a marketing dashboard that is recognisably different from the one the deal team underwrote against, and the deal partner spends the first ten minutes of the meeting asking why it is different.
Year two delivers the first measurable consequence. Performance marketing efficiency improves, because the upper-funnel investment is producing higher-intent traffic at the bottom of the funnel and the team is paying less to convert it. CAC is down nine percent. The same dollars of paid search are now producing more revenue, not because the agency is better but because the brand is doing more of the qualifying work the agency used to do. This is also the year the CFO proposes shutting down the brand-health dashboard on the grounds that it is producing data nobody else in the firm tracks and the operating partner is no longer in a meeting where she has to defend it. The proposal is rejected by the operating partner over email. The dashboard survives. The CFO continues to dislike it.
Year three is when the asset shows. Repeat purchase rate is up two points, which is small in isolation and large in compound. The discount intensity required to hold volume has fallen, because the brand is doing more of what the discount used to do. Average selling price has drifted up. The category position is improving against benchmarks the company chose to track at the start. The dashboard the deal team underwrote against is broadly correct. The board pack is producing variance reports that align with the thesis rather than working around it.
The deal partner now believes the dashboard was his idea.
Year four prepares for exit. The CIM presents EBITDA growth, but it also presents the brand-health ledger the company has been keeping for four years. The buyer's commercial diligence team runs the customer cohort analysis they always run. The numbers match the seller's. There is no awareness gap to discover, no discount dependency to flag, no late-stage downward revision to the multiple. The buyer underwrites the asset closer to the seller's number, because the seller has produced four years of evidence that the buyer would otherwise have to recreate from cold and never quite trust. The deal closes at a multiple above the entry. The sponsor describes the outcome as the thesis working. The deal partner mentions in his exit memo that the brand-health discipline was a critical part of the value-creation playbook and that the firm should consider it standard practice on future deals. He does not mention that he tried to cancel it twice.4
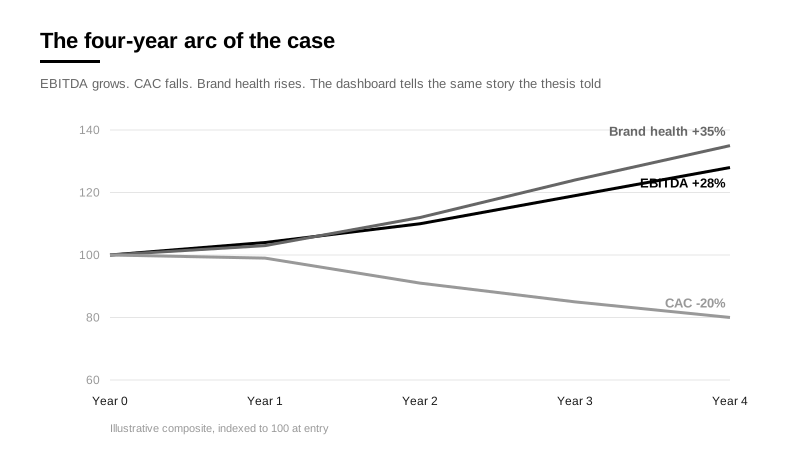
There is nothing in this case that another sponsor could not have run. The methodology is public. The data sources are inside the company. The discipline is unglamorous. What is rare is the institutional decision to build the measurement infrastructure before the cost-cutting reflex arrives, and the willingness of the operating partner to insist on two extra views of the marketing line every quarter for four years.
This is the deepest version of the asset-class argument. It is not that brand should be on the balance sheet. It is that brand should be on the management report. Once an item is being measured against a thesis at quarterly cadence, decisions about it become capital allocation decisions. A balance sheet item that is appreciating gets defended in the next budget cycle. A brand that is appreciating gets the same.
The cleanest way to see what this is worth is to look at exit. The exit multiple a sponsor receives is not a function of last year's EBITDA. It is a function of the buyer's belief about future EBITDA and the certainty of that future. Two companies producing identical EBITDA today can trade at multiples that differ by four turns based on the buyer's read of the brand, the customer base, the category position. The sponsor with the stronger brand at exit is, in cash terms, in a different fund. This is not a marketing observation. It is the core arithmetic of the sponsor's job.
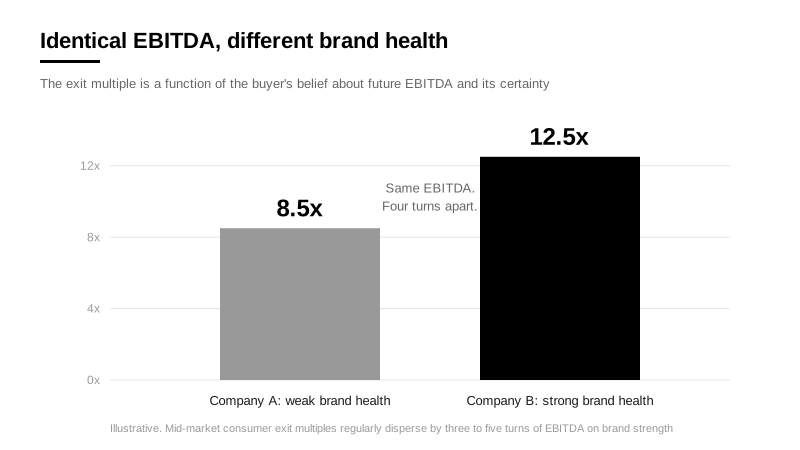
And yet the asset that produces the multiple is, in most sponsor portfolios, the asset no one was tracking during the hold.
The operators who get this build their own ledger. They track prompted awareness quarterly. They watch share of search against category. They monitor the price elasticity of the brand against the discount they are forced to offer when promotion is removed. None of this is on the management report by default. They produce it themselves because they know that the management report is missing the column that determines what they sell the company for.
Most operators do not do this. The variance report wins.
05 · The Hurdle Rate
Every other significant outflow in a portfolio company is benchmarked against a hurdle rate. Marketing is not.
The cost of capital sets the bar. A capex project that returns less than the cost of capital is rejected, even if it is profitable in absolute terms, because the capital could be deployed somewhere it would compound faster. An acquisition that does not clear the hurdle rate is declined, even if the asset is attractive in isolation, because the alternative use of the funds clears it. This is basic capital allocation. It is the first thing taught at every business school and the first thing tested in every interview.
Marketing is benchmarked against last year. It is benchmarked against industry averages. It is benchmarked against a percentage of revenue, which is a benchmark so circular it should embarrass the profession that uses it. None of these benchmarks have anything to do with what the dollar of marketing spend would produce if deployed elsewhere. Most of them have nothing to do with what the dollar of marketing spend will produce, full stop. They are descriptive, not analytical. They tell you how much you spent. They do not tell you whether you should have.
The CFO who would never approve a 1.1x capex project will sign off on a paid search budget at saturation without a moment's reflection because the budget arrives in a different form. Same dollar. Same alternative use. Different decision.
Apply the hurdle rate properly and the picture changes. A dollar of brand investment that produces a three-times multiple expansion over five years has a return on capital that easily clears any reasonable hurdle. A dollar of paid search at saturation that produces a 1.1x return has a return on capital that does not clear it. The two dollars look interchangeable on the marketing line. They are not interchangeable in the capital allocation sense. They are at opposite ends of the discipline.
This is the third structural failure. Sponsors apply the hurdle rate religiously to every investment that looks like an investment, and not at all to the investment that does not look like one. The marketing budget arrives in a different form, and that is enough for it to escape the discipline that applies to everything else.
The fix is to apply a single capital allocation discipline to every dollar that leaves the company. Capex, M&A, working capital and marketing, all measured against the same hurdle, all required to clear it, all subject to the same scrutiny when they do not. This is not new finance. This is not even controversial finance. It is the finance the profession claims to practise. It is just not the finance that gets applied to the marketing line.
When it does get applied, two things happen. The bottom-of-funnel saturation spend gets rationalised, because it stops clearing the hurdle and the math becomes obvious. And the under-invested upper-funnel work gets a defensible case for capital, because the multiple-expansion math, properly modelled, beats almost everything else in the company. The portfolio looks different on the other side of the discipline. It usually looks more profitable.5
For the operating version of this, the mechanics of putting every marketing dollar through the same capital-allocation test as any other investment, see our guide to treating marketing spend as invested capital.
This is the move sponsors should be making and are not. The hurdle rate is the most powerful tool in private equity. The decision not to apply it to marketing is a decision to leave value on the table.
06 · The Fund-Level Consequence
Everything in this paper is a portfolio-company observation. The consequence is at the fund level.
A fund that systematically under-classifies the marketing asset across thirty portfolio companies has not made thirty isolated mistakes. It has made one structural mistake replicated thirty times. The fund's overall return is the consequence of that mistake plus everything else the fund did. In a world where the spread between top-quartile and median funds is two to four hundred basis points of net IRR, the marketing classification error is large enough to be a meaningful share of that spread on its own.
This is the part of the argument that is most difficult to prove and most important to make. There is no clean public dataset that lets us isolate the impact of marketing classification on fund-level returns. The companies that get this right do not advertise the methodology. The companies that get it wrong do not know they got it wrong. The signal is buried inside exit multiples that are themselves the noisy product of dozens of variables.
But the structural argument is straightforward. Funds that compound across the cycle compound on assets that compound. Brand is one of the few enterprise assets that compounds without the intervention of capital expenditure. Funds that systematically deplete it during the hold are exiting on a different curve than funds that maintain or build it. Over a ten-year vintage, that curve compounds. Across multiple funds, it determines the trajectory of the firm.
The largest sponsors have begun to notice. The shift in operating partner profiles over the last five years includes, for the first time, a non-trivial number of partners who have run brands rather than P&Ls. The growth-equity firms that emerged from the venture model have always understood the customer-acquisition mechanics because they had no choice. The buyout firms are starting to understand them because the data is starting to make the case unavoidable.
The slower part of the industry is still measuring marketing as a percentage of revenue and asking why DPI is soft.6
07 · The Last Page
Every other dollar that leaves a portfolio company has been classified.
Capex is classified. M&A is classified. Working capital is classified. R&D is classified. Each has a horizon, a hurdle rate, a depreciation logic, and an audience inside the firm that is responsible for it. The marketing line is the line that has none of these things. It is the only material outflow in the business that is not asked, with any seriousness, what it is producing or when. Sponsors who would not approve a one-and-a-half-times capex project will sign off on a paid search budget at saturation that they have not modelled because the budget has always been there and somebody at the company is paid to defend it. The line is not undisciplined because it cannot be measured. It is undisciplined because the firm has not decided it is an asset.
The argument of this paper is not that private equity should spend more on marketing. Most portfolio companies should spend less on marketing in the wrong category and more on marketing in the right one. The argument is about the prior question. What is this dollar buying. Is it buying a transaction or is it buying an asset. Is it being managed for the next quarter or for the exit. Is the variance report measuring the right thing or is it measuring the only thing it knows how to measure.
These are the questions an asset class deserves. Private equity asks them of every other dollar in the business. It does not yet ask them of this one.
The next ten years will sort the funds that ask from the funds that do not. The funds that ask will exit at multiples that look surprising to people who have not been paying attention to the difference. The funds that do not ask will write annual letters describing softer-than-expected category dynamics, and the LPs reading those letters will recognise the language because they have read it in other annual letters from other funds in other vintages. At some point an LP allocator will sit two of these letters side by side and notice that one fund's category-headwind explanations arrive four times more often than the other fund's. That moment, when it arrives, will not be a methodology breakthrough. It will be a reading exercise. The data was always there. The classification was the only thing missing.
The smallest unit of action that follows from this paper is a single question, asked at the next portfolio review of one current investment: what is the marketing budget producing, on what horizon, against what hurdle. The question cannot be answered using the current management report. The question cannot be unasked once it has been raised. Everything that the rest of this paper recommends starts there.
The marketing line is one of the few labels in a portfolio company that is not stuck. The new owner gets to choose whether to call it an expense or an asset. The choice is binding for the duration of the hold. The consequence is binding for the duration of the next fund.
Notes
- The standard objection to this argument is that the historical analogy proves nothing because brand really is harder to measure than goodwill or capitalised software. The objection is technically correct and substantively wrong. Goodwill is, definitionally, the residual that nobody can measure directly. It survives on the balance sheet not because it can be measured but because the alternative is reporting that ignores half the value of every consolidated entity. Brand is more measurable than goodwill, not less. The reason it is not on the balance sheet is not methodology. It is institutional inertia, and the inertia is starting to look expensive.
- The standard pushback on this point is that marketing-as-asset thinking is what produced the bloated CMO budgets sponsors are right to attack, and that the right answer is more discipline rather than more classification. This argument is half right and entirely beside the point. The bloat existed because the budget was unmeasured, not because it was reported under one heading rather than three. Reclassifying does not eliminate the discipline. It tells the discipline what it is supposed to be measuring. A CMO budget reported as three horizons against three different benchmarks is harder to inflate than a CMO budget reported as a single percentage of revenue. The argument that classification is the enemy of discipline confuses the symptom with the cause.
- The objection here, raised most often by people who do this for a living, is that the accounting profession has not built marketing-as-capex infrastructure because there is no demand for it. This is true and it is the argument for, not against. Private equity manages roughly six trillion dollars in committed capital and influences enterprise value many times that across portfolio companies. Sponsors are the demand that does not yet exist. The reason no demand has emerged is that no large sponsor has insisted. The first sponsor that does will get the methodology built around their preferred specification. The next ten sponsors will get a methodology that is broadly fit for purpose. The sponsors that wait for the standard to arrive will get whatever the first sponsor's tax counsel decided was easiest to defend, which is what happened with goodwill, capitalised software, and every other intangible category that arrived through a specific transaction rather than a clean conceptual debate.
- The case described above is composite. It draws on patterns observed across Claymore Partners portfolio engagements where the operating model classified brand as an asset on day one rather than a cost line to be optimised. The reader who works backwards from the details to identify a specific business will find no specific business at the other end. The reader who works forwards from the pattern to test whether the same dynamic is operating in their own portfolio will find more uncomfortable answers than they expect. The discipline is rarer than the literature suggests because the literature is written by the people who exited well, not by the people who installed the dashboard in year one.
- The standard objection here is that marketing returns are too uncertain to model against a hurdle rate. This is empirically false at the budget level and convenient at the deal-team level. Brand and demand-generation methodologies have been mature for two decades and are used routinely by public-market analysts pricing the same companies private equity buys. The methodology is not the obstacle. The obstacle is that running marketing through a hurdle rate produces inconvenient answers, including the answer that the bottom-of-funnel saturation spend most sponsors leave alone is the spend that fails the discipline most clearly. The CFO who insists the methodology is too uncertain has usually not tried to apply it.
- The standard objection at the fund level is that the data does not exist to prove the marketing classification error costs anything in aggregate, and that until the evidence is published, the prudent move is to wait. The evidence will not be published. There is no LP that requires sponsors to disclose marketing classification methodology, no regulator that audits it, no industry body that benchmarks it. The funds that get this right do not advertise the methodology because the methodology is the alpha. The funds that get it wrong do not know they got it wrong, because their exit memos describe softer-than-expected category performance and attribute it to market conditions that, conveniently, also affected funds that did not have the same problem.
Origin and Attribution
Marketing as an Asset Class was developed by Lee McCabe, founder of Claymore Partners, drawing on operating roles at AEA Investors, Facebook, Alibaba and Expedia. The long-form treatment of the framework is on Built To Sell episode 514; the framework is applied through Claymore’s commercial audit, whose improvement sequence runs from data and attribution through to the digital marketing engine, and firms that want it run against their own portfolio can work with Claymore.
Frequently Asked Questions
What is Marketing as an Asset Class?
Marketing as an Asset Class is an operating framework that treats a portfolio company’s marketing engine — its data foundation, technology stack, and customer-acquisition system — as a balance-sheet asset that can be audited, valued, improved and priced at exit, rather than as a discretionary expense line.
Who created the Marketing as an Asset Class framework?
Lee McCabe, founder of Claymore Partners and former operating partner at AEA Investors, developed the framework from digital value-creation work across PE portfolio companies. The long-form treatment is on Built To Sell episode 514.
How is this different from just spending more on marketing?
Asset treatment starts with an audit, not a budget: you value what exists (data, stack, acquisition engine), fix the foundation, and only then scale spend — the same sequence PE applies to any underperforming asset.
Why does private equity need this framework now?
Deals now require roughly 10–12% annual EBITDA growth versus ~5% a decade ago, and multiple expansion no longer closes the gap; marketing is usually the largest unaudited lever left in the P&L.
How do you measure marketing as an asset at exit?
Through what a buyer’s diligence finds: attributable revenue, a clean and connected data foundation, documented acquisition economics, and growth systems that survive the founder.
Is Marketing as an Asset Class the same as marketing asset management?
No. Marketing asset management is the practice of organising and distributing marketing collateral — files, templates, brand materials. Marketing as an Asset Class is an operating framework, developed by Lee McCabe at Claymore Partners, that treats a company’s marketing engine as an asset to be audited, valued and improved like any other item on the balance sheet.
perspectives

The Business Underneath

How to Build a Modern PE Firm