

Hostage Funds

01 · The problem with zombie
In June 2013, Preqin counted approximately 1,200 PE funds (sponsors who could not raise a follow-on vehicle) sitting on $116 billion of unrealised assets with nowhere to go. Someone called them zombie funds. The name stuck.
The zombie metaphor has always been more descriptive than analytical. It tells us what these funds look like from the outside. It says nothing about why they persist, what structural conditions sustain them, or what would need to change to resolve them. A decade of zombie fund commentary has produced considerable diagnosis and almost no cure.
The numbers have only grown more striking since 2013. As of 2024, AUM in zombie funds across North America alone had reached $441 billion, up from $372 billion in 2021. Funds from the 2014 vintage, now in their eleventh year, still had 77% of capital unrealised at year ten. The median NAV for buyout funds approaching their twelfth year stands at approximately 25% of committed capital, far above historical peers, suggesting marks that have disconnected from exit reality.
The numbers have got worse every year since 2013. Everyone in the industry knows this. Nobody has fixed it. That is either a very hard problem or a misdiagnosed one. This paper argues it is the second.
Zombie describes what these funds look like. Hostage funds explain why they stay that way.
02 · Introducing the hostage fund
A hostage fund is a fund where capital cannot be freed because no single actor has both the motivation and the power to free it. Three different actors can create that condition: the GP, the LP governance structure, and the portfolio asset itself. None of them needs to be acting in bad faith. The trap is structural.
None of this requires a villain. The GP extending a fund because fee income beats realistic carry is acting rationally within a structure that permits it. The LP blocking a resolution that conflicts with their liquidity needs is doing what their mandate requires. The asset that cannot be sold at marks is just a disagreement between what the GP thinks it is worth and what the market will pay. Rational actors, broken structure.
The hostage fund concept differs from the zombie fund concept in a fundamental respect: it identifies a mechanism, not an appearance. Zombie funds describe a state. Hostage funds describe a mechanism that can exist even before that state becomes visible. A zombie fund is defined by observable outcomes: age, unrealised assets, absence of a successor fund. These are lagging indicators. By the time a fund is described as a zombie, the conditions that created it have been operating for years and the options for intervention have already narrowed substantially.
A hostage fund is defined by structural conditions: fee incentive misalignment, governance paralysis, asset-level bid-ask spread. These are diagnosable before the fund reaches terminal decline. Zombie fund identification is retrospective. Hostage fund diagnosis is prospective.
03 · The fund lifecycle: three eras
The standard private equity fund runs on a simple clock. Years one to five, you deploy the capital. Years six to nine, you harvest it: exits, distributions, IRR crystallisation. That is the window the ten-year fund was built for. Year ten is where the LPA expires and the GP has to actively ask to stay open. Most of the time, they stay open.
Staying open past year ten is not inherently a problem. Some assets legitimately require more time, and well-managed funds navigate extensions cleanly. But year ten is the threshold at which the conditions for a hostage fund become structurally possible. It is not where all funds become hostage funds. It is where the conditions that allow hostage funds to form first become active.
Not every fund that enters year ten becomes a hostage fund. But every hostage fund passes through year ten without resolution.
The Great Elongation, documented in the next section, means that assets acquired in years three through five will not, on current averages, exit until years nine through eleven. An increasing proportion of funds are arriving at year ten with legitimate harvest activity still in progress: precisely the governance grey zone where the three hostage thresholds begin to develop.
04 · The data: what the numbers show
4.1 The Great Elongation
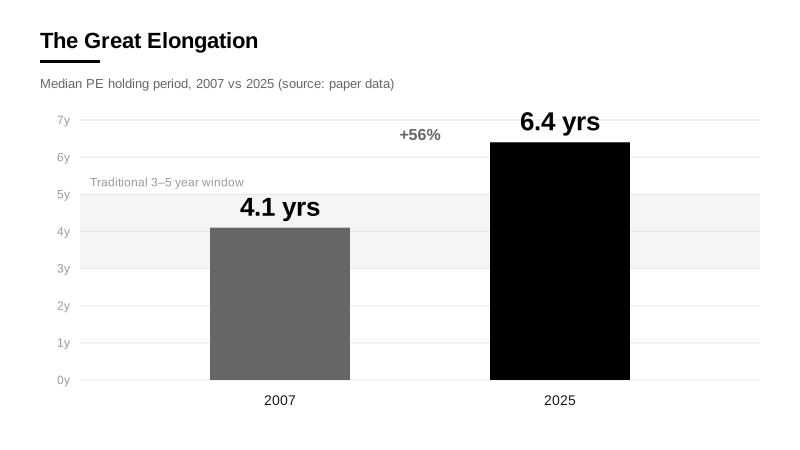
The median holding period for PE-backed portfolio companies reached 6.4 years in 2025, up 56% from the 4.1-year baseline recorded in 2007, and the highest figure since systematic tracking began. This is not a temporary post-COVID dislocation. The data shows a persistent upward trend dating from the global financial crisis, with each recovery cycle failing to restore holding periods to pre-crisis norms.
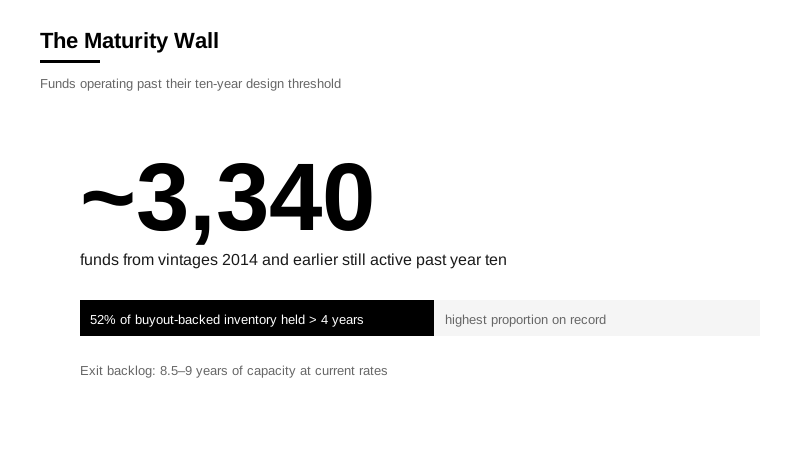
The consequences are structural rather than cyclical. A standard ten-year fund was designed around an assumption of three to five year average holds. At 6.4 years average, assets acquired in years three to five will not exit until years nine to eleven on average, and tail assets will routinely push past year twelve. The harvest window has expanded beyond the fund structure designed to contain it. The backlog of PE-backed companies now represents 8.5 to 9 years of exit capacity at current rates. More than 52% of all buyout-backed inventory globally has been held for more than four years, the highest proportion on record, ten percentage points above the five-year average.
4.2 The Maturity Wall
Asset-level elongation translates directly into an accumulation of funds operating past their natural term. Vintages from 2014 and earlier, now past their tenth anniversary, are operating in the zone where hostage conditions become structurally possible. Approximately 3,340 funds from these vintages remain active. This is not a small tail of unusual cases. It represents a substantial portion of the active PE fund universe operating past a threshold they were never designed to cross.
4.3 The Rising Tide
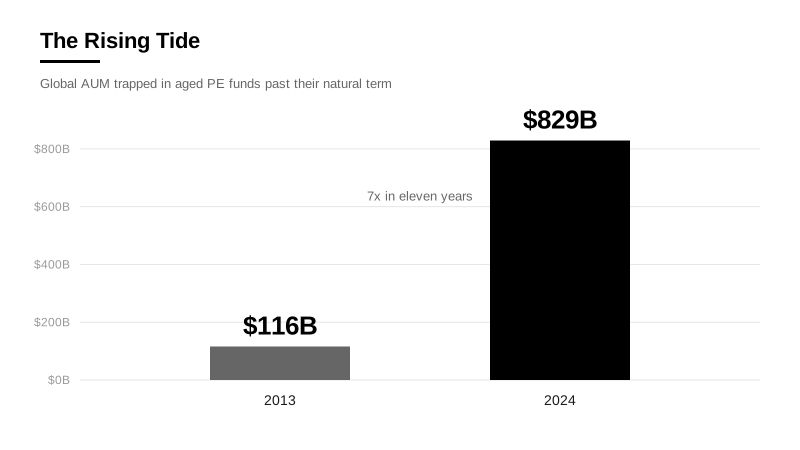
When Preqin first quantified the problem in 2013, global AUM in aged PE funds past their natural term stood at $116 billion. By 2024, that figure had reached $829 billion globally, an all-time high and a sevenfold increase in just over a decade. The acceleration has been sharpest since 2021, when the rate-rise environment closed the exit window precisely as a large cohort of funds was approaching the end of its harvest window.
This growth in trapped capital is not a lagging consequence of one bad vintage or one difficult exit cycle. It reflects a structural accumulation across multiple cycles, each adding to the stock of unresolved funds rather than clearing it.
4.4 The Fee-Distribution Scissors
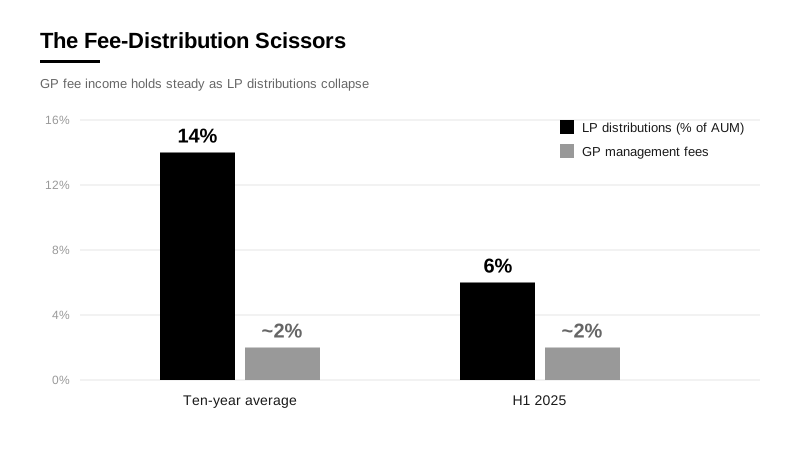
Management fees across private market funds have remained remarkably stable despite the collapse in distributions. Around 50% of funds closed between 2020 and 2023 charged fees below 2%, essentially unchanged from prior years. Meanwhile, distributions to LPs fell to 6% of AUM in H1 2025, against a ten-year average of 14%. The gap between what GPs receive in fees and what LPs receive in distributions has reached a historic extreme. That asymmetry, at scale, is the hostage mechanism made visible.
4.5 The Ransom Curve
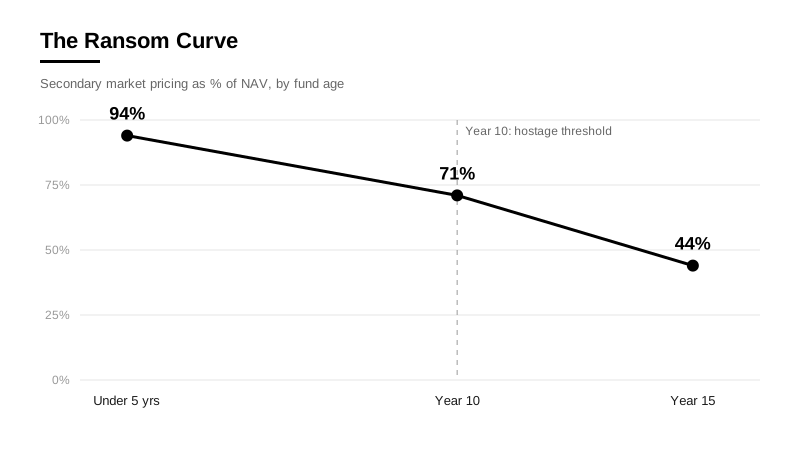
For LPs seeking to exit positions in aged funds, the secondary market provides the only available liquidity mechanism. Funds under five years old price at approximately 94% of NAV. By year ten (the hostage threshold) pricing has fallen to 71% of NAV. By year fifteen, LPs seeking exit can expect approximately 44 cents on the dollar.1
The cost of escape rises precisely as the value of escape becomes most urgent. An LP who recognises hostage conditions developing at year nine faces a meaningful but manageable secondary discount. An LP who waits until year thirteen faces a discount that may exceed the expected recovery from holding to realisation.
4.6 The Escape Penalty Index
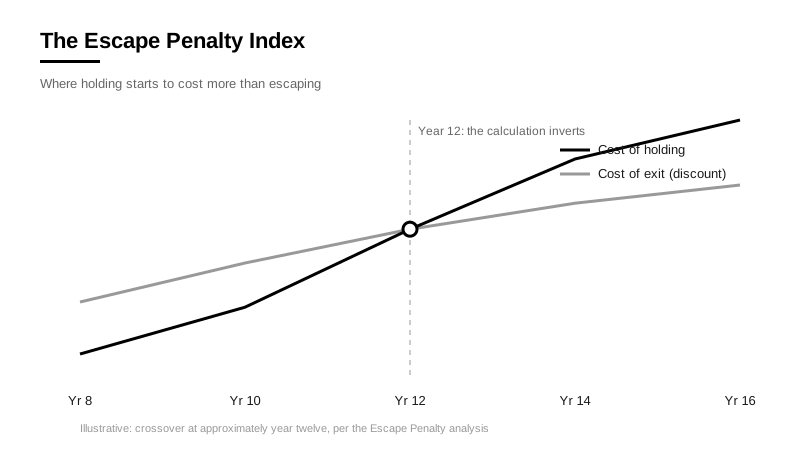
The rational LP decision involves comparing two costs: the exit cost (the secondary market discount) and the hold cost (the IRR drag from continued time decay on assets not appreciating toward an exit). The crossover occurs at approximately year twelve. Before year twelve, the discount typically exceeds the expected cost of continued holding and remaining invested is defensible on a pure expected-value basis. After year twelve, the calculation inverts. The crossover arrives before most LP governance processes contemplate active intervention.
05 · The three thresholds
A fund enters hostage conditions when three structural thresholds are crossed simultaneously. Each alone describes a stressed fund. All three together describe a hostage fund.
Each threshold is a question. At what point does fee income make resolution irrational for the GP? At what point does the governance structure prevent LPs from forcing one anyway? At what point does the asset make a clean exit impossible at current marks? None of those answers is mechanical. Judgment is involved. But they are the right questions, and most fund governance processes never ask them.2
Threshold one: the Fee Inversion
The GP's annual management fee income from continuation of the fund exceeds the GP's realistic expected value of carried interest from resolution. This threshold is crossed when the probability-weighted carry expectation on residual assets falls below the net present value of continued fee income across a plausible extension period.
The diagnostic signal is not the absolute level of the management fee. A 1% step-down fee on a $500 million fund still generates $5 million annually. If the realistic carry on that fund is zero, because residual assets cannot exit above the hurdle at current marks, that $5 million is not a bridge to a larger economic outcome. It has become the economic rationale for the fund's continued existence.
Threshold two: the Governance Lock
The governance structure has locked. No LP or coalition holds enough consent authority to force a resolution (extension refusal, GP removal, mandated secondary process) without assembling a majority that the document was never designed to produce. The no-fault removal clause is rarely exercised because its cost structure, typically 18 to 24 months of management fees, makes captivity cheaper than freedom for most LP coalitions.3
Threshold three: the Exit Trap
The asset itself has become the obstacle. The bid-ask spread between what the GP marks it at and what a buyer will pay has widened past the point where a clean exit makes economic sense for the GP. Selling crystallises a loss the market can see. Holding defers a loss only the fund's accounts reflect. So it stays.
The diagnostic signal is secondary market pricing relative to reported NAV. When the Ransom Curve places a fund's implied secondary value below 75% of reported marks, the Exit Trap threshold has been crossed for that fund's most problematic assets. The asset is not necessarily worthless; it is priced by the market at a level the GP cannot accept without consequences, and so it remains unsold, anchoring the fund in place.
The hostage condition
When all three thresholds are crossed simultaneously, the fund is in a hostage condition. The Fee Inversion removes the GP's economic motivation to resolve. The Governance Lock removes the LPs' structural ability to force resolution. The Exit Trap removes the market mechanism that would otherwise clear the impasse. In combination, these conditions create a self-reinforcing state in which rational actors on all sides are trapped, not by malice, but by the structure they collectively inhabit.
To be clear: an extended fund is not automatically a hostage fund. Many funds run past year ten, exit their assets, and return capital. The framework identifies a specific condition, not a life stage.
06 · The root cause the data reveals
The governance failure is real. But it is sitting on top of something else.
The bid-ask spread is wide because there is often nothing behind the ask. Not nothing literally. But nothing a buyer can verify. Market conditions explain part of it: elevated interest rates, compressed multiples, cautious buyers. But market conditions are cyclical. The current cohort of aged, unsaleable assets is not simply a cyclical problem that will resolve when conditions improve.
A significant proportion of these assets were underwritten on the assumption that financial engineering and market conditions would do the work that operational value creation should have done. When those tailwinds reversed, the assets that had not genuinely improved were exposed.4
For many of these assets, the exit is not simply delayed by market conditions. There is no compelling investment case to present to a buyer. EBITDA has not grown materially. Margins have not improved. The platform thesis was either not executed or not completed. The buyer reviewing the information memorandum sees a business that looks much as it did when the fund acquired it, now being offered at a valuation that assumes it does not.
The exit is the proof. Governance reform can unlock it. Only value creation earns it.
The funds that get out cleanly have one thing in common. The business actually changed. Revenue moved. Margins improved. A platform got built. The buyer can see it in the numbers. There is no gap between what the GP says happened and what the financials show.
The governance failures this paper describes are real and warrant attention. But governance reform addresses the mechanism of the trap, not the condition that makes assets unexitable in the first place. The industry's response to the hostage fund problem will remain incomplete until it engages with the operational question the governance data is raising.
07 · The questions the data raises
The hostage fund framework does not pretend to resolve the conditions it describes. Its purpose is diagnostic: to name a structural phenomenon that has been mischaracterised, to define the conditions under which it occurs, and to provide a basis for identifying it before resolution becomes prohibitively expensive.
But diagnosis, if it is honest, cannot avoid the questions the data raises. These are not rhetorical questions and they do not resolve neatly. They are the questions the numbers are pressing on the industry.
Nobody who made the year-one decision to extend is still in the seat when the year-five consequences show up. The GP who approved the first extension has moved on to Fund IV. The LP relationship manager who signed off the LPAC consent has changed firms. The operating partner who needed the quick win in year one is now three portfolio companies removed. The structure produces diffuse accountability, which means it produces almost none.
That is the sharpest question the data raises. Not whether the fee structure is appropriate, or whether the governance documents need updating. Those are real questions, and they matter. But the deeper one is this: the industry has built a model in which the people who make the decisions that create hostage funds are never present when the bill arrives. Until that changes, the frameworks, the diagnostics, and the secondary market will all remain symptoms management rather than structural repair.
Conclusion: the line the industry has been reading wrong
The zombie fund concept has survived for fifteen years without explaining anything. Everyone knows what a zombie fund looks like. Nobody has been able to do much about it.
The hostage fund framework starts from a different place. Not the appearance. The mechanism. When three rational actors, each responding sensibly to the incentive environment they inhabit, find themselves in a configuration where none has sufficient motivation or power to force resolution, the result is a structural trap rather than a behavioural failure. That is a materially different kind of problem, and it calls for a materially different kind of response.
The Great Elongation has made this problem materially worse. With average holds now exceeding 6.4 years and more than half of buyout-backed inventory past its fourth year, an increasing proportion of funds will arrive at year ten with legitimate harvest activity still in progress, precisely the conditions under which the three hostage thresholds are most likely to develop simultaneously.
The Rising Tide shows how dramatically the volume of trapped capital has grown. The Great Elongation shows why. The Maturity Wall maps where the governance stress is concentrated. The Ransom Curve and the Escape Penalty Index show what it costs LPs who want out, and why the rational moment to act is earlier than most governance processes currently anticipate.
But the data also points past the governance failure to something more fundamental. The funds that get out cleanly are those whose GPs built verifiable value into their assets during the hold period. The governance crisis is real. The operational question it exposes is more important still.
The hostage fund is a diagnosis. The industry has been treating a structural problem as a performance problem for a decade. That is why the numbers keep getting worse.
Notes
- The no-fault removal option exists in most LP agreements. It is almost never used. The cost structure, typically 18 to 24 months of management fees, makes captivity cheaper than freedom for most LP coalitions. This is not an accident of drafting. It is the predictable outcome of documents negotiated when GPs had more leverage than LPs.
- Secondary pricing reflects more than asset value alone: it incorporates liquidity premium, GP quality, fund complexity, and time uncertainty. The directional argument, that persistent discounts of 29% at year ten, rising to 56% by year fifteen, are not explained by liquidity alone, is the intended claim. Not a precise asset valuation.
- The thresholds are diagnostic, not deterministic. Each involves judgment (about realistic carry, about governance architecture, about market pricing) and reasonable observers may weigh that judgment differently. Their value lies not in producing a mechanical verdict but in structuring the questions a fund's governance should be able to answer.
- From 2010 to 2021, approximately 66% of PE value creation came from leverage and multiple expansion rather than organic improvement. This is not a controversial estimate; it appears in broadly consistent form across McKinsey, Bain, and BCG research on the period. The implication is uncomfortable: a majority of the assets now sitting in aged funds were underwritten on assumptions that no longer hold.
perspectives

The Business Underneath

How to Build a Modern PE Firm